Pancreatic cancer is a terrible hide-and-seek player in the moral sense, but an excellent one in the clinical sense. By the time pancreatic ductal adenocarcinoma announces itself, it has often already packed a bag, changed addresses, and left oncology holding the forwarding notice.
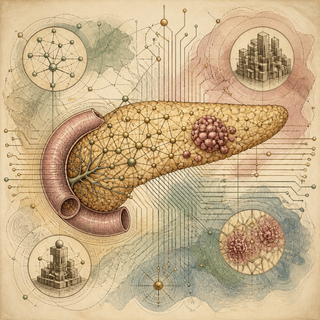
Yang and Fan’s Cancer Discovery commentary spotlights a study by Min, Schweizer, and colleagues that uses AI-powered Deep Visual Proteomics to map early pancreatic cancer evolution in space, not just in a spreadsheet. Notice how that changes the exhibit: instead of asking, “What proteins exist in this tissue soup?” the researchers ask, “Which proteins are active in this exact neighborhood, at this exact stage, next to these exact cells?” That is cartography with a microscope, and the pancreas is the extremely cranky country being mapped.
The Tissue Does Not Get Blended
Traditional molecular profiling often treats tissue like a smoothie. Useful, yes. Refreshing, no. Spatial proteomics keeps the address labels attached.
Deep Visual Proteomics combines computational pathology, laser microdissection, and mass spectrometry. In plain English: AI helps identify meaningful tissue regions, lasers cut out tiny cell groups, and mass spectrometry reads the proteins present there. The method profiled normal ducts, acinar-to-ductal metaplasia, low-grade and high-grade PanIN lesions, and invasive cancer. If you look closely, the magic is not “AI found cancer.” The magic is that AI helped guide where to look, so the protein measurements still knew where they came from.
That matters because proteins are the cell’s working staff. DNA is the recipe, RNA is the shopping list, but proteins are the kitchen crew actually burning the toast.
The “Normal” Ducts Were Not So Innocent
The headline result is wonderfully unsettling: molecular changes appeared before obvious histologic transformation. The team quantified 9,181 proteins from tiny regions of roughly 100 cells and found a “field effect” in histologically normal ducts near cancer. Translation: some areas looked normal under the microscope while already carrying molecular mood lighting that said, “Something is off in this room.”
They also found that low-grade PanIN lesions differed depending on cancer context, suggesting that not all early precancers are following the same script. Four stage-associated programs emerged, including early stress adaptation and immune engagement, metabolic reprogramming that begins early and intensifies, and mitochondrial remodeling in high-grade PanIN before invasion. Mitochondria, once again, are not content being “the powerhouse of the cell”; they want a speaking role in the crime drama.
The study even detected KRAS hotspot mutant peptides in incidental precursor lesions from cancer-free individuals. That does not mean every tiny lesion is destined for disaster. It means protein-level spatial maps may help sort background biological noise from the early choreography of risk.
Why the AI Part Matters
AI is useful here because tissue is messy. Cells overlap, lesions are rare, and the pancreas does not politely arrange its precancers into labeled museum drawers. Machine learning can help segment images, identify regions, connect morphology to molecular readouts, and eventually compare patterns across cohorts. Recent work in spatial omics has leaned hard into these tasks, from spatial data integration in PanIN progression to deep-learning-assisted sparse sampling for whole-tissue proteomics.
Honestly, if you are trying to track the route from normal duct to ADM to PanIN to invasive cancer, this is where a visual map on mapb2.io starts looking less like procrastination and more like self-defense.
The Catch, Because Science Has Rent Due
This is not a screening test you will see at your next physical. The findings need replication across larger cohorts, different labs, and clinically realistic samples. Spatial proteomics still wrestles with cost, throughput, tissue preservation, standardization, and the basic unfairness that proteins cannot be amplified the way DNA can. Mass spectrometers are powerful, but they are not vending machines for truth.
Still, the direction is compelling. If these patterns hold up, they could help identify biomarkers for earlier detection, reveal which precursor lesions deserve closer attention, and point toward interception targets before invasive cancer takes over the gallery.
References
-
Yang M, Fan R. Spatially Resolved Proteomic Cartography Illuminates the Earliest Molecular Programs in Pancreatic Cancer Evolution. Cancer Discovery. 2026. PMID: 42381461.
-
Min J, Schweizer L, Zonderland G, et al. AI-Powered Deep Visual Proteomics Reveals Critical Molecular Transitions in Pancreatic Cancer Precursors. Cancer Discovery. 2026. PMID: 42013410.
-
Bell ATF, Mitchell JT, Kiemen AL, et al. PanIN and CAF transitions in pancreatic carcinogenesis revealed with spatial data integration. Cell Systems. 2024;15(8):753-769.e5.
-
Braxton AM, Kiemen AL, Grahn MP, et al. 3D genomic mapping reveals multifocality of human pancreatic precancers. Nature. 2024;629:679-687.
-
Qin R, Ma J, He F, et al. In-depth and high-throughput spatial proteomics for whole-tissue slice profiling by deep learning-facilitated sparse sampling strategy. Cell Discovery. 2025;11:21.
-
Method of the Year 2024: spatial proteomics. Nature Methods. 2024;21:2195-2196.
Disclaimer: This blog post is a simplified summary of published research for educational purposes. The accompanying illustration is artistic and does not depict actual model architectures, data, or experimental results. Always refer to the original paper for technical details.